Business Resources
We know photography is your passion and owning a successful photography business is your dream! That’s why PPA supports our members with essential resources and tools to help your business grow and thrive profitably. Download and explore these tools today!
 The Square One Tool – A Game Changer to Plan for Success!
This tool allows you to plan for a profitable photography business from day one! It helps you custom design your business plan by using the recommended benchmarks for cost of sales (COS), general expenses and net profit. By simply entering a few numbers you’ll be able to create your sales and sessions projection goals for the year. Once you have those numbers you’ll be able to create a sales and marketing plan to reach those goals. By beginning with the end in mind this tool helps you focus your intention on what’s most important and helps you make better decisions about how and where to spend your time and money.
Building a profitable photography business begins with clarity. In this video, we explore how to set realistic net income goals, calculate cost of sales, and use industry financial benchmarks to build a sustainable business plan.
PPA's Financial Benchmark Business Guide for Photographers — Based on 20 Years of Research
There are three main recommended benchmarks when it comes to building a profitable and sustainable business. These are percentages of total sales for cost of sales (COS), general expenses and net profit.
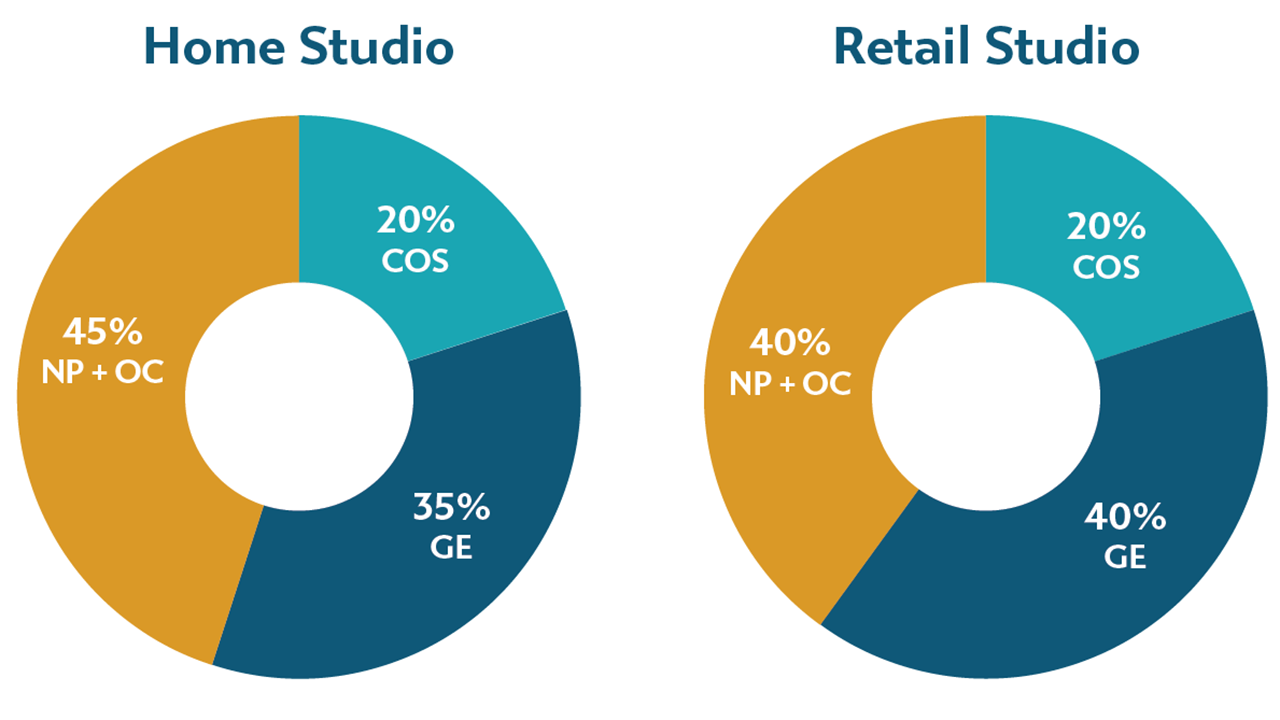
PPA’s recommended benchmarks are based on 20 years of research. This research was done to clearly identify what a profitable photography business looks like. By using the information found in the Survey Analysis you’ll gain confidence when goal setting, budgeting, pricing and making other decisions that relate to your business finances.
Understanding these numbers also helps you to set up your business so that you can manage it effectively in real time (managerial accounting). By comparing your numbers to the recommended benchmarks you’ll quickly see where your strengths and weaknesses lie, allowing you to recognize and respond to opportunities and quickly make changes when faced with challenges.
Note: The benchmark surveys were last completed in 2024 with results being consistent across all surveys over a 20 year time period. This survey was not intended to be a state of the industry analysis but rather a way to benchmark profitability.
This guide is a step-by-step manual to help you build a strong foundation for your photography business. With it, you will gain a firmer grasp on the basics of running a profitable studio, goal setting and budgeting, planning for success, and growing your business.
Break Down the Terms
These are some of the key financial terms used in the survey and the accompanying financial strategy articles and reports.
A set of financial targets to help photography businesses achieve financial success. The benchmarks are expressed as a percentage of total sales. For example, the cost of sales benchmark is 25%, meaning you should spend no more than one quarter of your total sales on the cost of producing your products.
Cost of sales (COS), also known as cost of goods sold (COGS), refers to the time and materials that go into making the products you sell. Frames, paper, retouching, printing, production contractors—if the cost of something is directly related to the sale of a product, including your time, it is part of your COS. Tracking COS helps you determine if you’re pricing profitably and if you’re squeezing every penny out of your workflow.
Sometimes called fixed costs, these are the expenses that stay the same, no matter how much—or how little—you sell. Rent, utilities, office supplies and non-production employee salaries are some examples. If you group them into categories, they can help you get a better picture of where your money goes and areas you could potentially trim costs. PPA recommends the following expense categories:
- Administration Expense (accounting/legal, auto expense, education, consumer interest, office expense, props and accessories, telephone)
- Building Expense (building maintenance, real estate taxes, rent or mortgage interest, utilities, insurance)
- Employee Expense (salaries and benefits)
- Marketing Expense (advertising and promotion)
- Depreciation Expense (capital expenditures more than $500)
- Owner's Compensation (the salary and benefits you pay yourself)
Managerial accounting helps you understand the "why" behind your business expenses, instead of just "what" your expenses are. It's a way of arranging your financial numbers so that you can more easily categorize your expenses and then compare them directly with the benchmarks. By comparing your numbers to the recommended benchmarks you’ll quickly see where your strengths and weaknesses lie, allowing you to recognize and respond to opportunities and quickly make changes when faced with challenges.
This benchmark is where the rubber meets the road. It’s the tell-all measurement of the profitability of your studio, a.k.a. your bottom-line profit. It's critical to not only measure this, but also to set targets for the percentages you want and need to hit every year. To better understand this term, let's break it down:
- Owner's compensation is just what it sounds like: how much you pay yourself as personal income. This includes your owner's salary, draw or dividends from the business.
- Your studio's net profit is the money left over after your studio has paid all the bills (including owner's compensation).
Combining these two figures offers a couple of very important benefits. Believe it or not, you could be paying yourself more than—or less than—your company can afford. Also, since every studio owner handles personal compensation a little differently, combining these two metrics will allow you to measure yourself "apples to apples" against other studios. That will help you set more effective goals.
Also referred to as "gross sales" or "gross revenue," total sales is the total amount of money taken in by your business on an annual basis. That means all your revenue from products, services, licensing and anything else you sell to clients.